 Ever wondered how you get the indicator tab in the SentinelOne AI SIEM alerts populated? Sadly the official documentation is more misleading than helpful so hopefully I can shed some light on it.
The default market place integrations use of the Unified Alert indicators is a bit hit and miss (more miss). You get excited the indicator tab is populated but then disappointed when you see the data whoever configured the integration decided to push through.
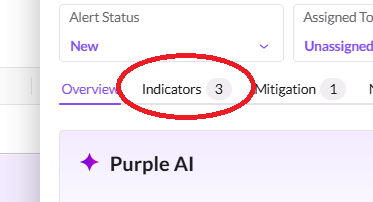
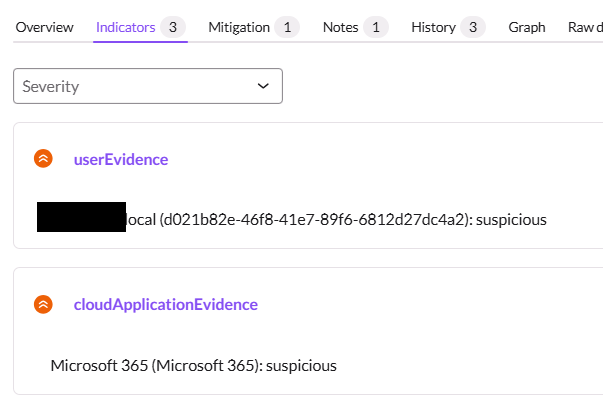
As you can see from the screenshot the default integrations has included 3 indicators in this alert, however none of these make sense from a standard indicator in Cyber security perspective.
There are no IP addresses or domain names or file hashes. Just very random objects.
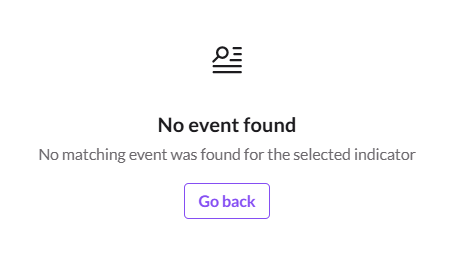 If you click on the blue heading it then shows a No Event Found error message.
This is because the alert was generated with a finding_info.related_events JSON array section, which listed the indicators. However the indicators in most marketplace integrations have not been posted to the indicator API either 4 hours before or 1 hour after the alert was generated, so you get the No Event Found message,
These JSON below shows the SentinelOne datalake query run when you click the indicator.
{“endTime“:”2025-08-02T00:53:01.000Z”,”filter“:”dataSource.name = \”indicator\” and metadata.uid = \”xxxxxxxx.local (d021b82e-46f8-41e7-89f6-6812d27dc4a2): suspicious\””,”origin”:”UNKNOWN”,”startTime“:”2025-08-01T19:53:01.000Z”
Again the query fields of note are the endTime (1 hr after alert), startTime (4 hrs before alert) and filter (indicator dataSource and metadata.uid).
If there had of been indicators matching, it would only display the first one. This didnt make sense to me to only display indicators in such a small time window, though on the other hand an indicator may be benign in the morning but in the afternoon detection engines have marked it malicious so a 4 hour look back windows is workable. When I enrich indicators I usually don’t enrich more frequently than every 4 hours to lessen use of 3rd party enrichment services api limits.
How do you get something in the indicator dataSource?
Now this is the poorly documented section in the SentinelOne customer portal, so hopefully this helps.
Basics
Endpoint URL: https://ingest.us1.sentinelone.net/v1/indicators (check documentation for the domain relevant to your tenant)
Headers Required:
-
Authorization (Bearer token)
-
Content-Type (application/json)
-
S1-Scope (accountid)
-
Request Content-Encoding (gzip)
Items of Note
- This metadata.uid is what ties an alert to an indicator when someone clicks indicator in an alert. It however doesnt have to be in a uuid format. You can use an ip address or a domain for example as the metadata.uid (which is helpful)
- You will get a http 202 status code for pretty much everything as long as your API authentication is correct. It basically means the indicator api was happy with the headers, it doesn’t mean the indicator will be ingested.
Sample Indicator Post Body
{

"message": "Malicious ELF executable",

"time": 1753389296000,

"file":

{

"name": "badmalware.exe",

"type_id": 1,

"type": "Sample Indicator Threat"

},

"metadata":

{

"version": "1.1",

"product":

{

"name": "Sample Feed"

},

"extensions":

[

{

"name": "sample-alerts",

"version": "1.1"

}

],

"profiles":

[

"s1/security_indicator"

],

"uid": "554e63ce-983a-4452-93a7-54c2ac608333"

},

"type_uid": 100101,

"activity_id": 1,

"class_uid": 1001,

"category_uid": 1,

"observables":

[

{

"name": "file.name",

"type_id": 7,

"value": "badmalware.exe"

},

{

"name": "url.address",

"type_id": 6,

"value": "https://evil.com/badmalware.exe"

}

],

"severity_id": 2,

"attack_surface_id": 1

}
Now when you click the indicator in an alert you will get a popup screen with the information you posted to the indicator API.
It is really hit and miss with the sadly lacking documentation the fields you can submit to the indicator API but help is at hand……
If you know how to submit data, i.e. ingest it via a log collector or send to the raw log ingest API or event ingest API then you can more easily submit your own indicators and ignore the silly Unified Alert indicator API. Simply set your parser (log collector/raw) or JSON fields (event collector) to specify the below dataSource json fields:
“dataSource.name” : “indicator”
“dataSource.category” : “security”
Now you just need to ensure each event your ingesting has a metadata.uid field and job done!